Creates a `InputHeatmap` object from `tbl_df` on evaluation creates a `ComplexHeatmap`
Source:R/methods.R
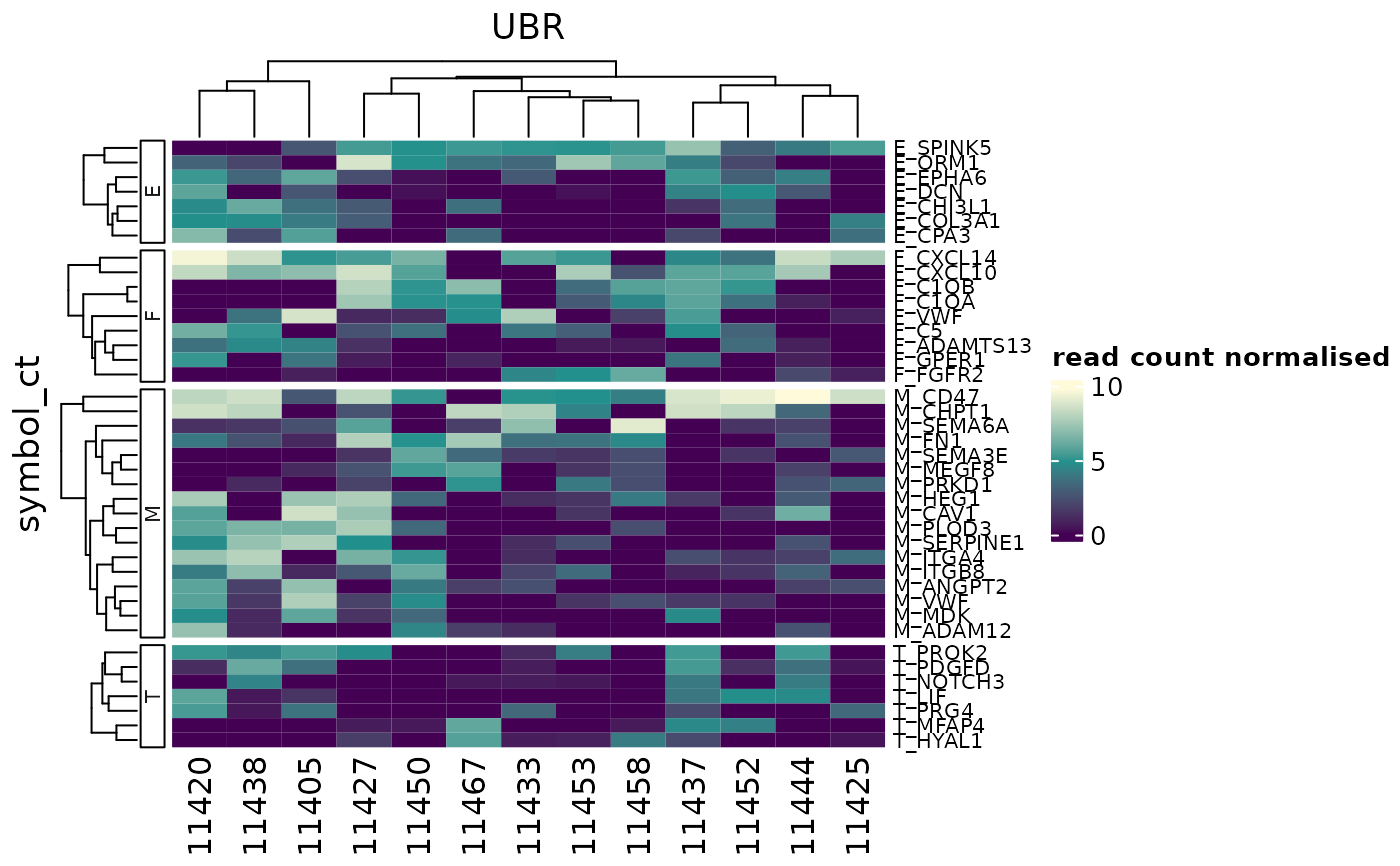
heatmap-method.Rdheatmap() takes a tbl object and easily produces a ComplexHeatmap plot, with integration with tibble and dplyr frameworks.
heatmap(
  .data,
  .row,
  .column,
  .value,
  transform = NULL,
  scale = "none",
  palette_value = c("#440154FF", "#21908CFF", "#fefada"),
  palette_grouping = list(),
  .scale = NULL,
  ...
)

heatmap_(
  .data,
  .row,
  .column,
  .value,
  transform = NULL,
  scale = "none",
  palette_value = c("#440154FF", "#21908CFF", "#fefada"),
  palette_grouping = list(),
  .scale = NULL,
  ...
)

# S4 method for class 'tbl'
heatmap(
  .data,
  .row,
  .column,
  .value,
  transform = NULL,
  scale = "none",
  palette_value = c("#440154FF", "#21908CFF", "#fefada"),
  palette_grouping = list(),
  .scale = NULL,
  ...
)

# S4 method for class 'tbl_df'
heatmap(
  .data,
  .row,
  .column,
  .value,
  transform = NULL,
  scale = "none",
  palette_value = c("#440154FF", "#21908CFF", "#fefada"),
  palette_grouping = list(),
  .scale = NULL,
  ...
)
Source
[Mangiola and Papenfuss., 2020](https://joss.theoj.org/papers/10.21105/joss.02472)
Arguments
- .data
A `tbl_df` formatted as | <ELEMENT> | <FEATURE> | <VALUE> | <...> |
- .row
The name of the column to use as rows
- .column
The name of the column to use as columns
- .value
The name of the column to use as values
- transform
A function to transform the data (optional)
- scale
One of "none", "row", "column", or "both" for scaling
- palette_value
A character vector of colors or a function for value colors
- palette_grouping
A list of color palettes for grouping annotations
- .scale
DEPRECATED: Use scale instead
- ...
Additional arguments passed to ComplexHeatmap
Value
An `InputHeatmap` object that gets evaluated to a `ComplexHeatmap`
A `InputHeatmap` object
A `InputHeatmap` object
A `InputHeatmap` object
Details
![[Maturing]](figures/lifecycle-maturing.svg)
This function takes a tbl as an input and creates a `ComplexHeatmap` plot. The information is stored in a `InputHeatmap` object that is updated along the pipe statement, for example adding annotation layers.
References
Mangiola, S. and Papenfuss, A.T., 2020. "tidyHeatmap: an R package for modular heatmap production based on tidy principles." Journal of Open Source Software. doi:10.21105/joss.02472.