Background knowledge for the Tidy Transcriptomics workshop
Maria Doyle, Peter MacCallum Cancer Centre1
Stefano Mangiola, Walter and Eliza Hall Institute2
Source:vignettes/background.Rmd
background.Rmd![]()
Schedule
Schedule can be found here.
Format: Hands on demos plus Q&A Interact: Zoom chat
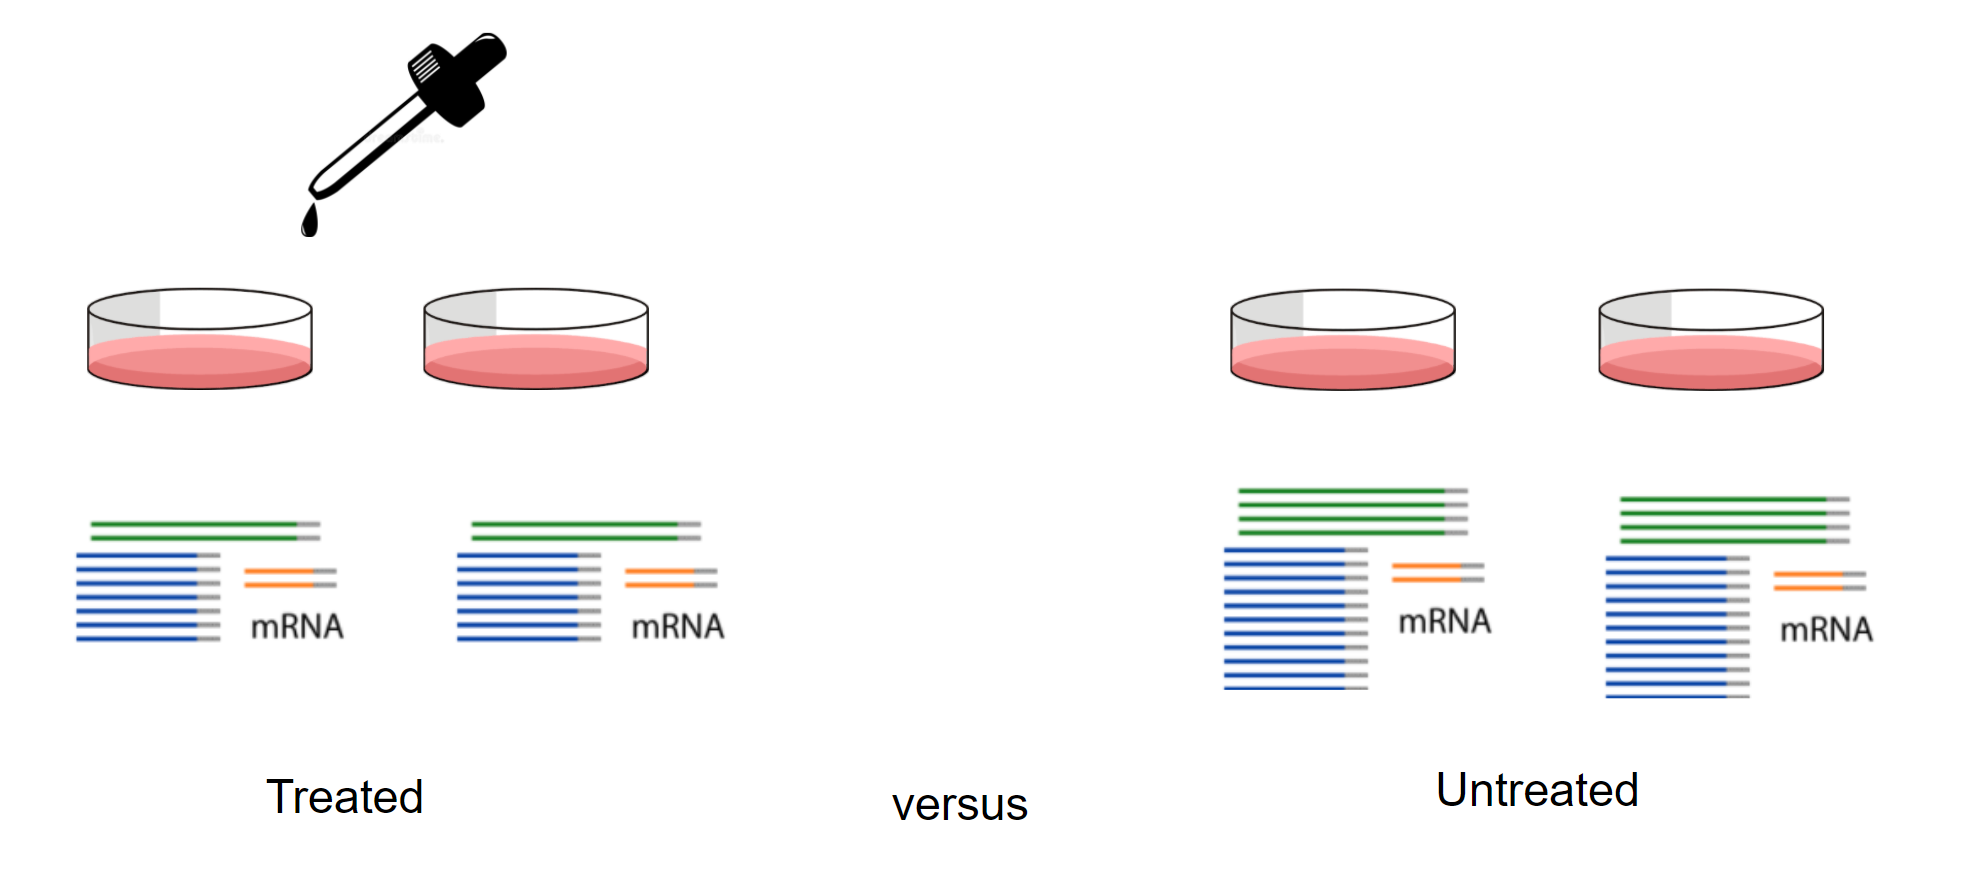
What is transcriptomics?
“The transcriptome is the set of all RNA transcripts, including coding and non-coding, in an individual or a population of cells”
Wikipedia
![]()
Why use transcriptomics?
- Genome (DNA) pretty stable
- Proteome (proteins) harder to measure
- Transcriptome (RNA) can measure changes in expression of thousands of coding and non-coding transcripts
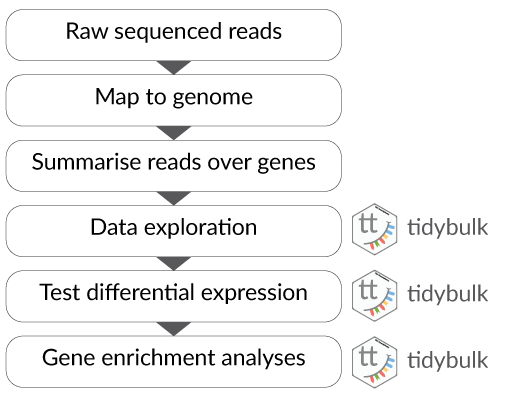
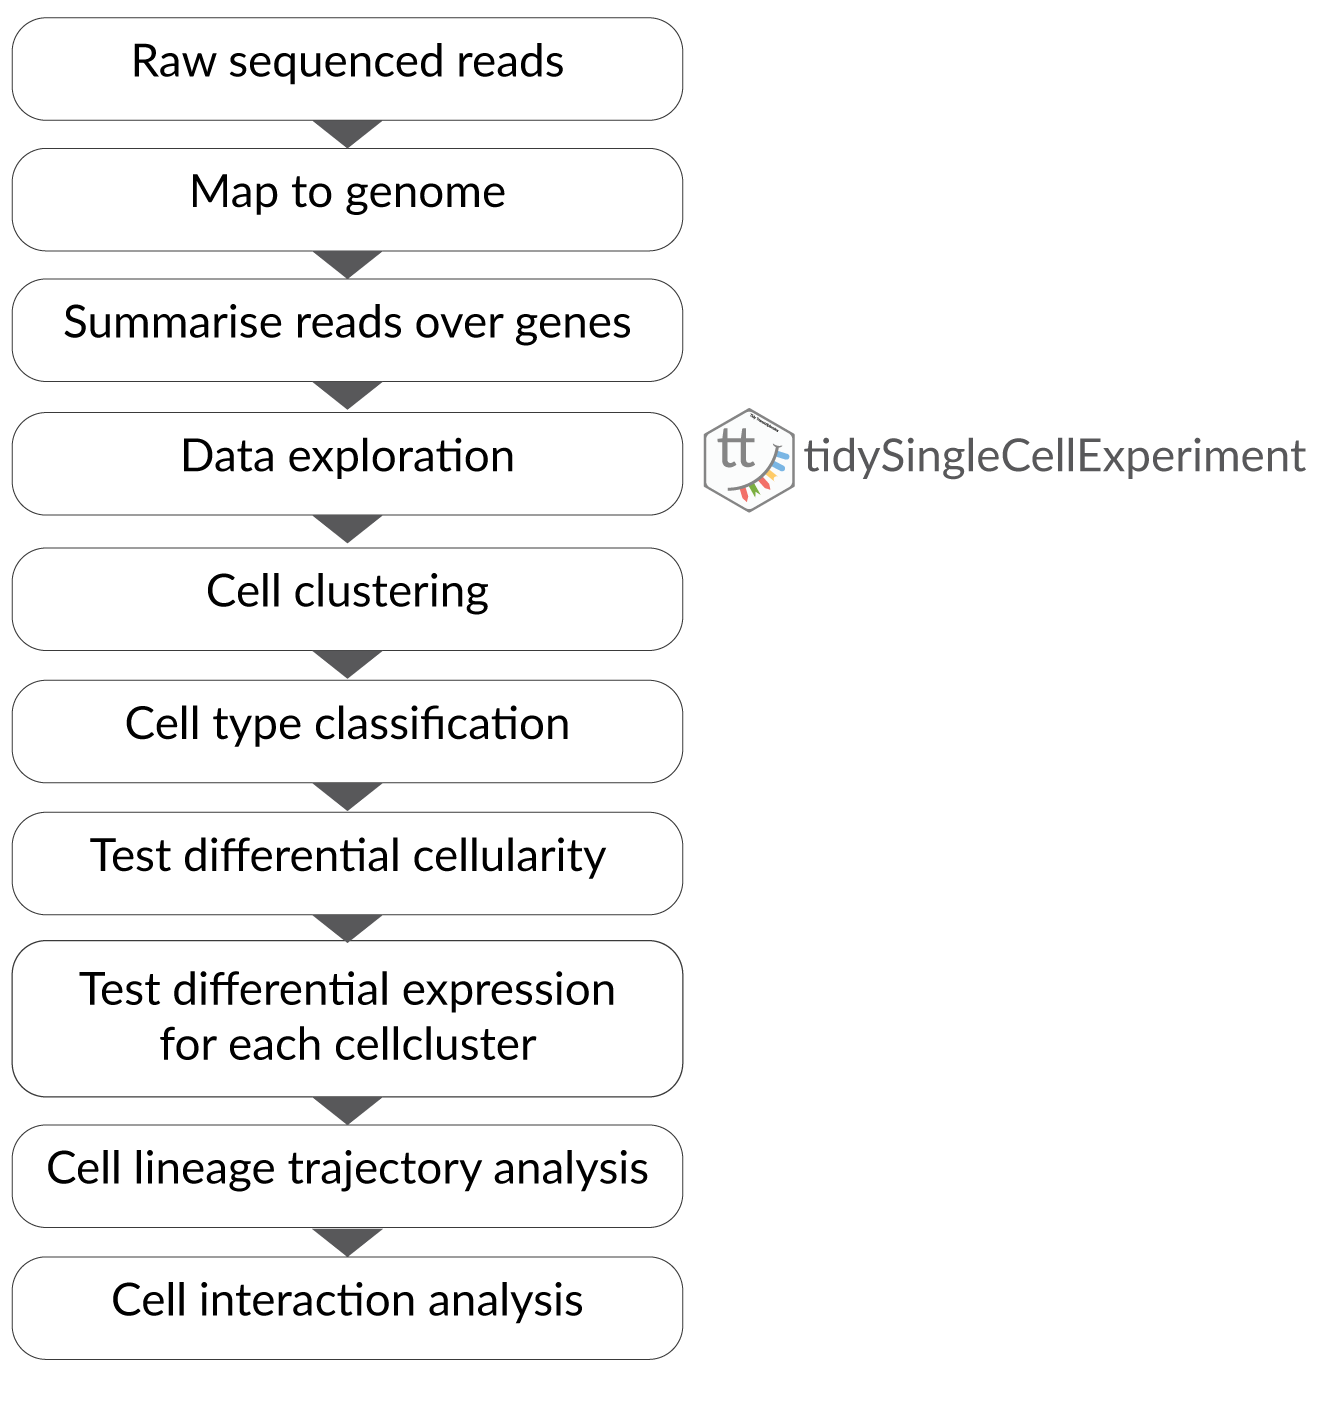
Types of transcriptomic analyses
-
Differential expression
-
Cell type composition
- Alternative splicing
- Novel transcript discovery
- Fusions identification
- Variant analysis
Topics in bold we will see in this workshop
Tidy data and the tidyverse
This workshop demonstrates how to perform analysis of RNA sequencing data following the tidy data paradigm (Wickham and others 2014). The tidy data paradigm provides a standard way to organise data values within a dataset, where each variable is a column, each observation is a row, and data is manipulated using an easy-to-understand vocabulary. Most importantly, the data structure remains consistent across manipulation and analysis functions. For more information, see the R for Data Science chapter on tidy data here.
](../inst/vignettes/tidydata_1.jpg)
The tidyverse is a collection of packages that can be used to tidy, manipulate and visualise data. We’ll use many functions from the tidyverse in this workshop, such as filter, select, mutate, pivot_longer and ggplot.
](../inst/vignettes/tidyverse.png)
Adapted from Getting Started with tidyverse in R