`annotation_group()` adds group annotation strips to a tidyHeatmap object, allowing you to visually group rows or columns based on categorical variables. This is useful for highlighting biological or experimental groups in your heatmap.
Source
[Mangiola and Papenfuss., 2020](https://joss.theoj.org/papers/10.21105/joss.02472)
Arguments
- .data
A tidyHeatmap object
- ...
Grouping columns (unquoted, like dplyr::group_by)
- palette_grouping
List of color vectors for each grouping. Each element should be a vector of colors for the corresponding grouping variable.
- group_label_fontsize
Font size for group labels
- show_group_name
Logical, show the group annotation name
- group_strip_height
Height of group strip as a grid unit (default: 9pt)
Value
A tidyHeatmap object with group annotation strips added
References
Mangiola, S. and Papenfuss, A.T., 2020. "tidyHeatmap: an R package for modular heatmap production based on tidy principles." Journal of Open Source Software. doi:10.21105/joss.02472.
Examples
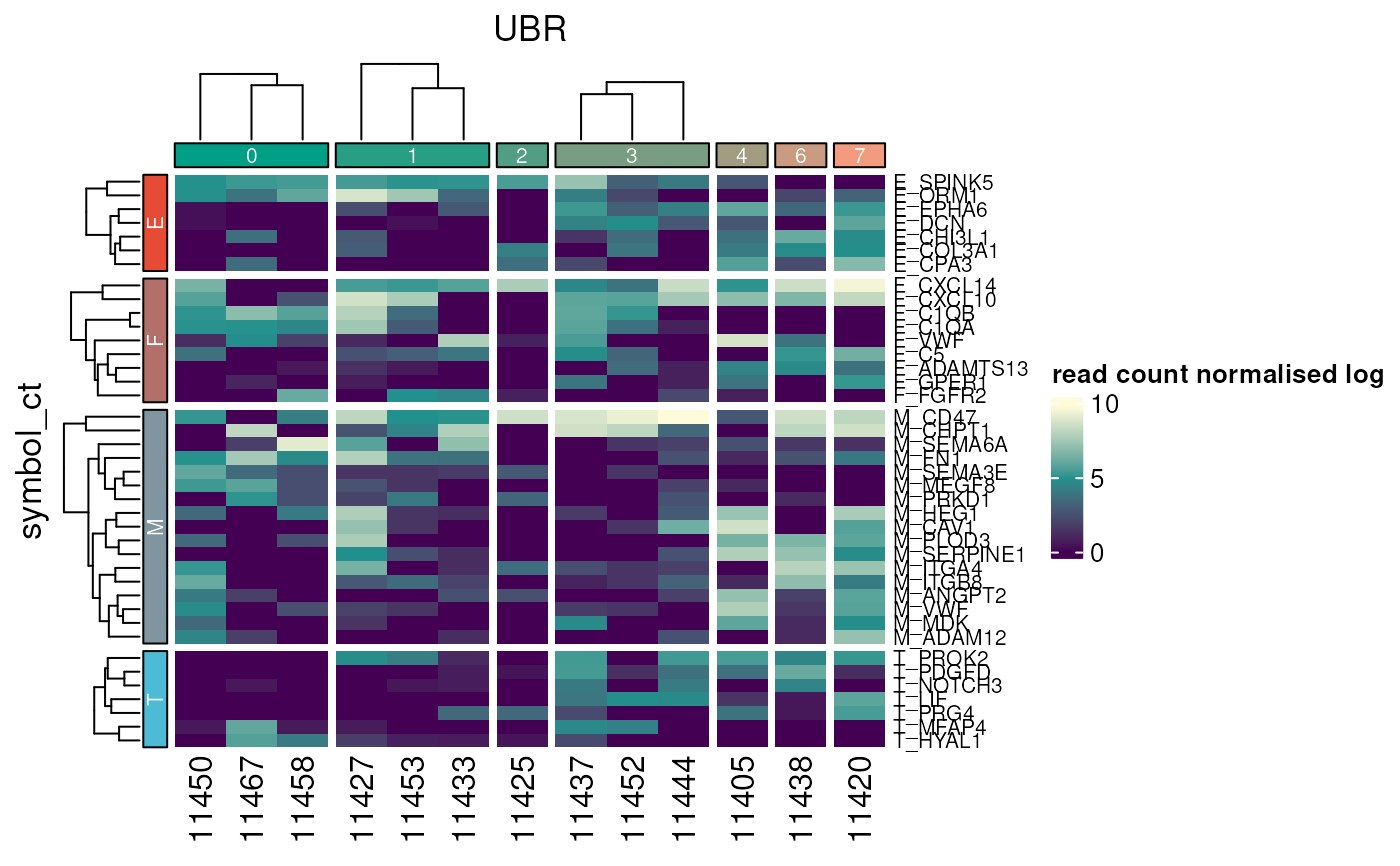
# Basic usage with row grouping
tidyHeatmap::N52 |>
tidyHeatmap::heatmap(
.row = symbol_ct,
.column = UBR,
.value = `read count normalised log`
) |>
annotation_group(CAPRA_TOTAL)
 # With custom colors and formatting
tidyHeatmap::N52 |>
tidyHeatmap::heatmap(
.row = symbol_ct,
.column = UBR,
.value = `read count normalised log`
) |>
annotation_group(
CAPRA_TOTAL,
palette_grouping = list(c("#E64B35", "#4DBBD5")),
group_label_fontsize = 10,
show_group_name = FALSE
)
# With custom colors and formatting
tidyHeatmap::N52 |>
tidyHeatmap::heatmap(
.row = symbol_ct,
.column = UBR,
.value = `read count normalised log`
) |>
annotation_group(
CAPRA_TOTAL,
palette_grouping = list(c("#E64B35", "#4DBBD5")),
group_label_fontsize = 10,
show_group_name = FALSE
)
 # Multiple grouping variables
tidyHeatmap::N52 |>
tidyHeatmap::heatmap(
.row = symbol_ct,
.column = UBR,
.value = `read count normalised log`
) |>
annotation_group(
CAPRA_TOTAL,
`Cell type`,
palette_grouping = list(
c("#E64B35", "#4DBBD5"), # colors for CAPRA_TOTAL
c("#00A087", "#F39B7F") # colors for Cell type
)
)
# Multiple grouping variables
tidyHeatmap::N52 |>
tidyHeatmap::heatmap(
.row = symbol_ct,
.column = UBR,
.value = `read count normalised log`
) |>
annotation_group(
CAPRA_TOTAL,
`Cell type`,
palette_grouping = list(
c("#E64B35", "#4DBBD5"), # colors for CAPRA_TOTAL
c("#00A087", "#F39B7F") # colors for Cell type
)
)