Adds a point annotation layer to a `InputHeatmap`, that on evaluation creates a `ComplexHeatmap`
Source:R/methods.R
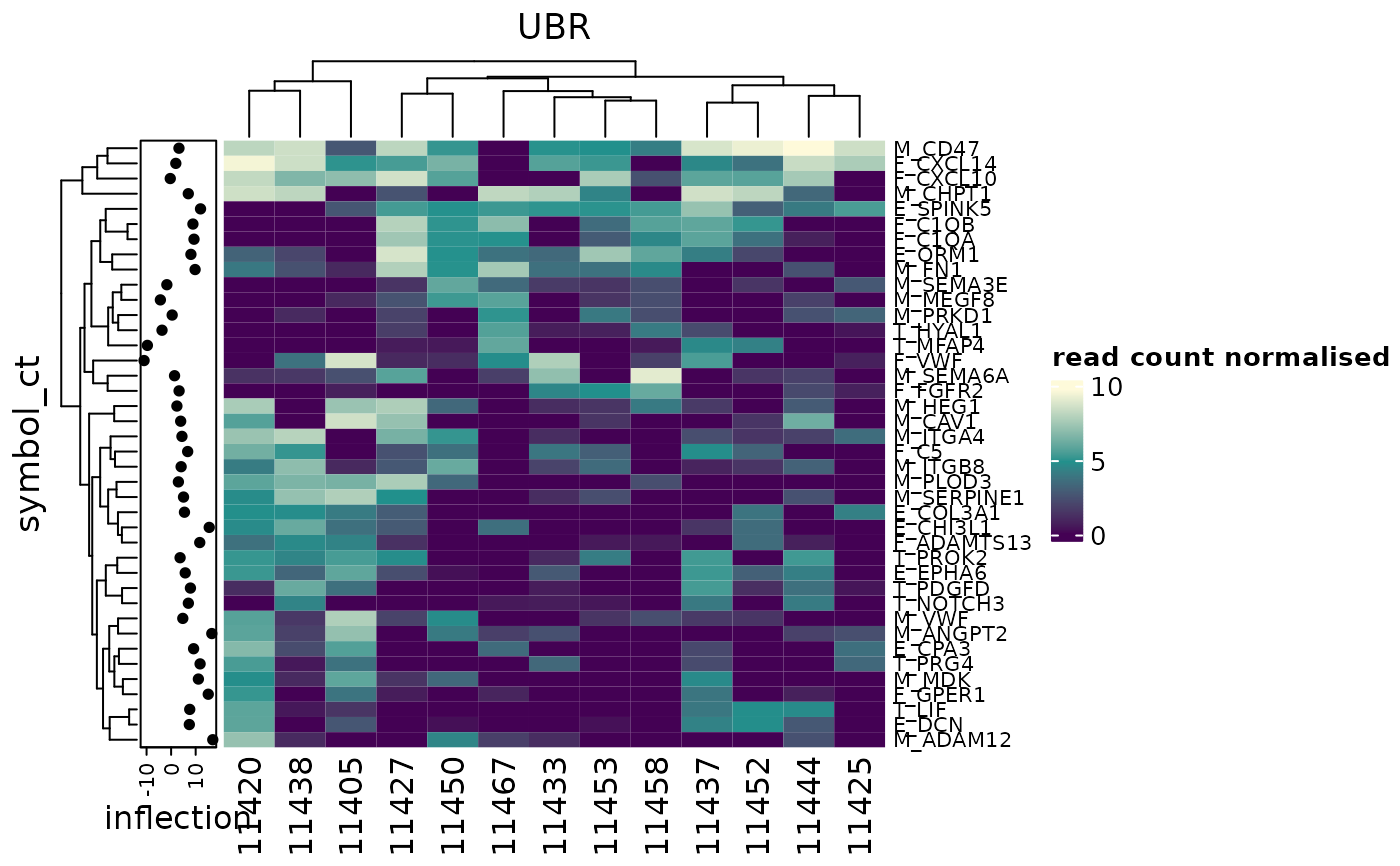
annotation_point-method.Rdannotation_point() from a `InputHeatmap` object, adds a point annotation layer.
annotation_point(.data, .column, palette = NULL, size = NULL, ...)

# S4 method for class 'InputHeatmap'
annotation_point(.data, .column, palette = NULL, size = NULL, ...)
Source
[Mangiola and Papenfuss., 2020](https://joss.theoj.org/papers/10.21105/joss.02472)
Arguments
- .data
a `InputHeatmap` object created calling `tidyHeatmap::heatmap()`
- .column
Vector of quotes
- palette
A character vector of colors, or a function such as colorRamp2 (see examples).
- size
A grid::unit object, e.g. unit(2, "cm"). This is the height or width of the annotation depending on the orientation.
- ...
The arguments that will be passed to
anno_pointsandHeatmapAnnotationif you want to fine tune the aesthetics.
Value
A `InputHeatmap` object that gets evaluated to a `ComplexHeatmap`
A `InputHeatmap` object that gets evaluated to a `ComplexHeatmap`
Details
![[Maturing]](figures/lifecycle-maturing.svg)
It uses `ComplexHeatmap` as visualisation tool.
References
Mangiola, S. and Papenfuss, A.T., 2020. "tidyHeatmap: an R package for modular heatmap production based on tidy principles." Journal of Open Source Software. doi:10.21105/joss.02472.