it perform logit scaling with right axis formatting. To not be used directly but with ggplot (e.g. scale_y_continuous(trans = "log10_reverse") )
logit_trans()Value
A scales object
Details
`r lifecycle::badge("maturing")`
References
Mangiola, S., Molania, R., Dong, R., Doyle, M. A., & Papenfuss, A. T. (2021). tidybulk: an R tidy framework for modular transcriptomic data analysis. Genome Biology, 22(1), 42. doi:10.1186/s13059-020-02233-7
Wickham, H. (2016). ggplot2: Elegant Graphics for Data Analysis. Springer-Verlag New York. https://ggplot2.tidyverse.org
Examples
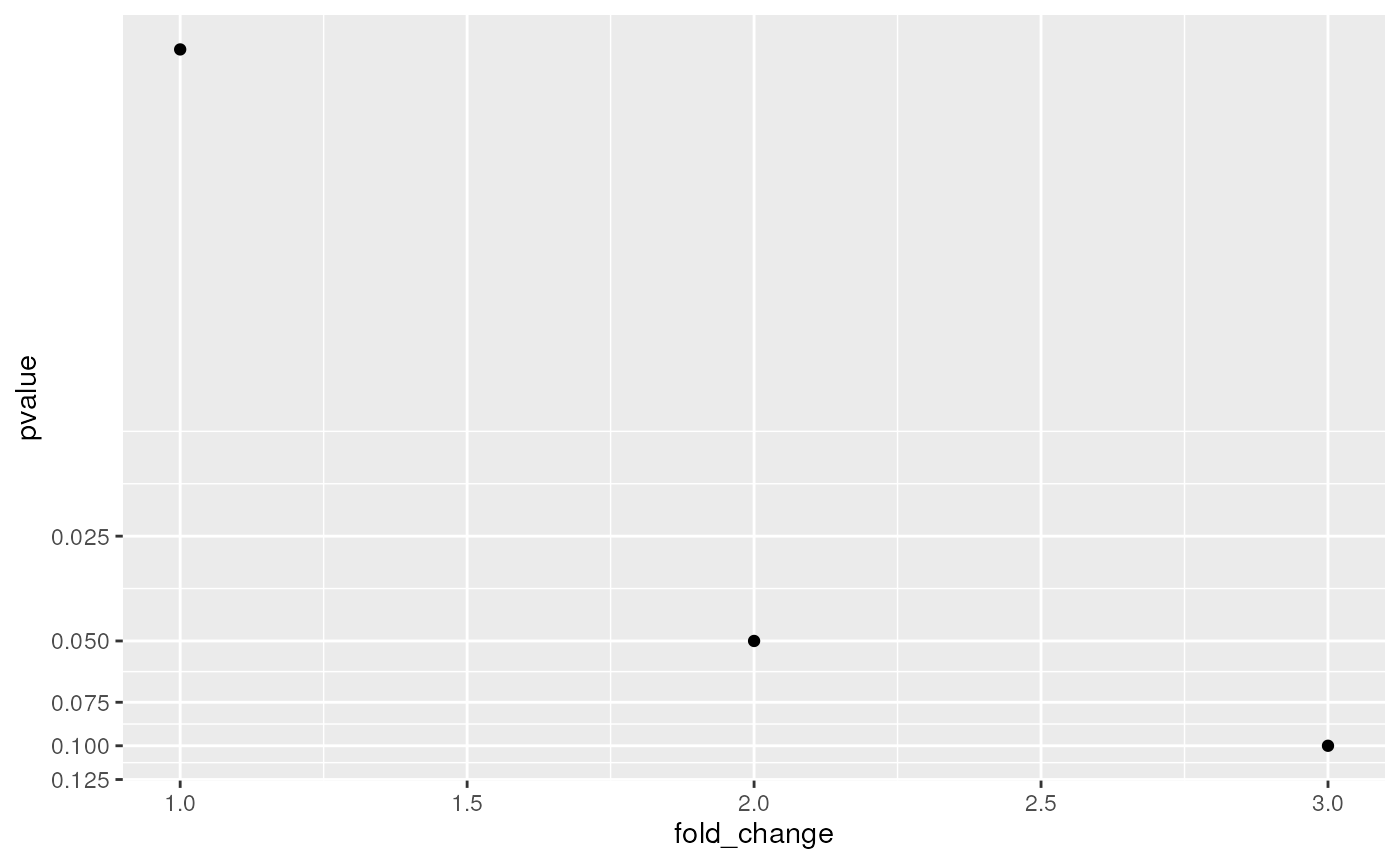
library(ggplot2)
library(tibble)

tibble(pvalue = c(0.001, 0.05, 0.1), fold_change = 1:3) |>
 ggplot(aes(fold_change , pvalue)) +
 geom_point() +
 scale_y_continuous(trans = "log10_reverse")