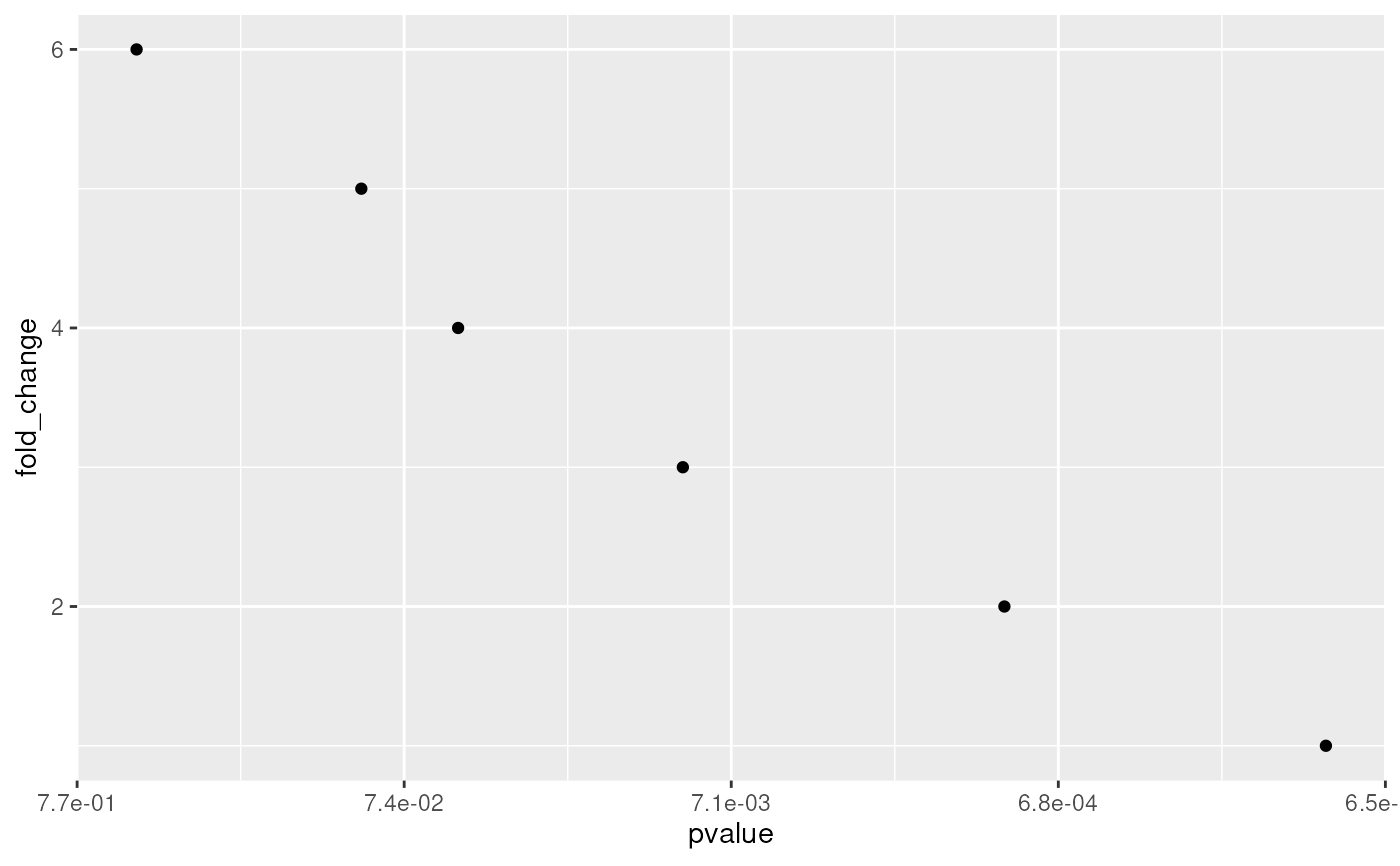
A wrapper function that provides evenly spaced ticks with scientific notation for log10 reverse transformed x-axis. This is particularly useful for plots showing p-values or other values where smaller values should be displayed larger. The function applies a log10 transformation and reverses the axis to better visualize p-values without hard transforming the data, while maintaining the original p-value scale for interpretation. This allows you to see the full range of p-values with proper scaling while keeping the original values readable.
scale_x_log10_reverse(breaks = 5, digits = 2, ...)Arguments
Value
A ggplot2 scale object
Details
`r lifecycle::badge("maturing")`
References
Mangiola, S., Molania, R., Dong, R., Doyle, M. A., & Papenfuss, A. T. (2021). tidybulk: an R tidy framework for modular transcriptomic data analysis. Genome Biology, 22(1), 42. doi:10.1186/s13059-020-02233-7
Wickham, H. (2016). ggplot2: Elegant Graphics for Data Analysis. Springer-Verlag New York. https://ggplot2.tidyverse.org